How do engineers and scientists select lunar landing sites and design traverses for rovers and astronauts? One of the most important datasets for mission planning and design is the Digital Elevation Model (DEM). Two ways that high-resolution DEMs are produced using Lunar Reconnaissance Orbiter (LRO) data include: (1) using the Lunar Orbiter Laser Altimeter (LOLA), which directly measures the distance from the spacecraft to the lunar surface and translates this into elevations, and (2) by using stereo images taken by the Narrow Angle Camera (NAC). NAC stereo images are acquired from slightly different angles and positions, and, as with human vision from the right and left eyes, their combination enables 3D visualization of the terrain. Thus, elevation information can be derived from image sets to generate DEMs.
Under the leadership of Prof. Harald Hiesinger, Lunar Reconnaissance Orbiter Camera (LROC) team members at the Institut für Planetologie, University of Münster, Germany, have developed an automated processing pipeline to generate NAC DEMs, given the vast number of stereo pairs (>7000) now available. Supported by the German Space Agency, the new pipeline has already processed about 2,000 pairs into preliminary DEM products.
The new pipeline enables rapid production and release of high-quality baseline DEMs, which are essential for initial assessments of landing-site slopes and for planning traverses by astronauts or robotic assets at numerous scientifically interesting locations on the lunar surface. In addition, these DEMs will enable the projection of various lunar datasets onto a three-dimensional surface, thereby facilitating accurate determinations of the orientations of geologic/compositional layers, thickness estimates, and the identification of boulder sources accessible to astronauts/robots at the base of steep slopes. When paired with NAC images, DEMs are also used for detailed geological studies, such as mapping and measuring impact craters, tectonic features, and regolith properties.
With the support of additional LROC team members led by Principal Investigator Dr. Mark Robinson at Intuitive Machines, 50 of these new DEMs are made available to the public for scientific and exploration purposes, on the Planetary Data System (PDS) release, and are also accessible on the Institut für Planetologie’s MUlti-TEmporal Database (MUTED) of planetary image data. In the future, DEMs from the pipeline will be released to the PDS on a regular basis.
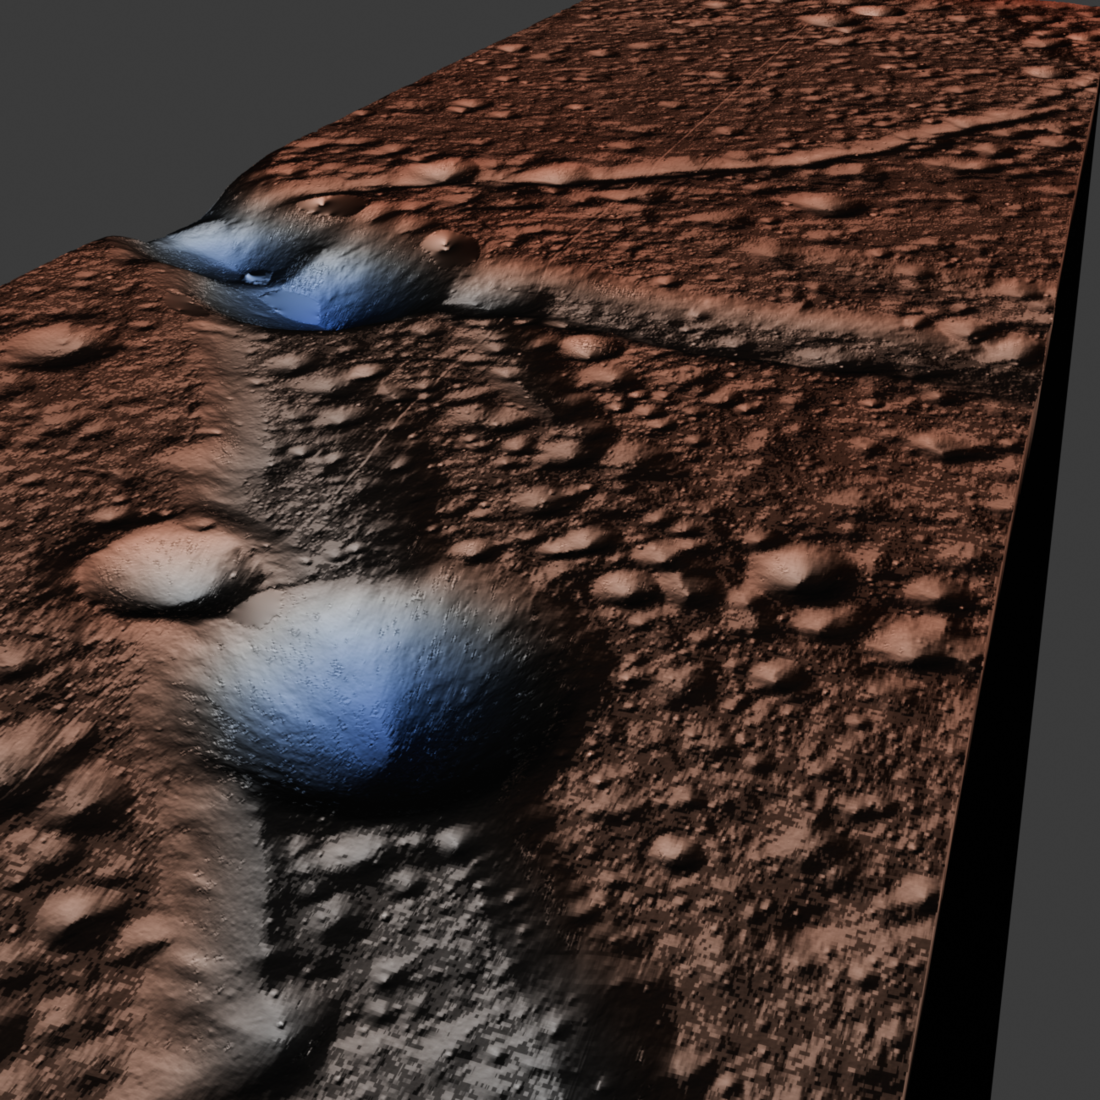
Flyover of a 3D model of the Rima Hyginus region. The automated pipeline does not always fully correct for elevation offsets between NAC image pairs, resulting in a graben-like artifact at the seam. Pixels for which no elevation could be calculated are left empty rather than filled with interpolated values, so that the limitations of the datasets are readily identifiable. Further details on the quality of the DEM can be obtained from the good-pixel map. Video Credit: University of Münster
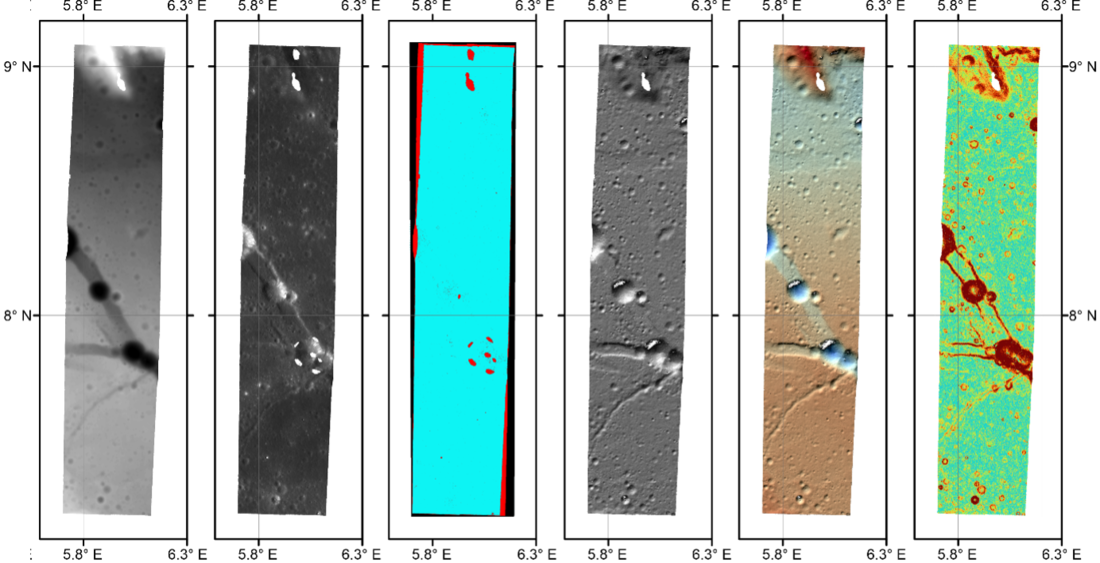
The pipeline uses Integrated Software for Imagers and Spectrometers (Anderson et al., 2004) and the Ames Stereo Pipeline (ASP; Beyer et al. 2018), along with custom Bash, Python, and MATLAB scripts, to calibrate, process, and archive the high-resolution DEM products and their related datasets (Schmedemann et al., 2025). The related datasets include a DEM, slope map, good-pixel map, hillshade map, colorized hillshade map, orthomosaics, and a README file containing dataset descriptions and information.
Related Featured Images
Topography of the Taurus-Littrow Valley
Published by Mark Robinson on 5 February 2026